Introduction
The aim of this exercise is to perform change detection and identify mechanisms of geomorphic change using topographic datasets from different timelines. The datasets have been provided for the Feshie River.
The given reach of the Feshie River is a braided river system evident with a number of channels across the width of the river. If we observe the DEM and also referring the google satellite imagery, the given reach represents a braided system with multiple channels and bars.
Datasets Used
To perform the change detection exercise, topographic datasets of the Feshie River from 2004, 2005 and 2006 have been used.
To perform the change detection exercise, topographic datasets of the Feshie River from 2004, 2005 and 2006 have been used.
Change Detection
The change detection excercise was done in ArcGIS along with the use of GCD add-in. A new GCD project was created to which DEM survey data was loaded for three different years. Some topographic changes were clearly visible on the visual comparison of the DEMs alone. Swiping one DEM above the other also helped to visually inspect the changes.
For each survey data, an error surface was also loaded. Then a change detection was carried out between the two surfaces (namely: 4 to 5 and 5 to 6).
Outcomes of Change Detection
1) First Epoch (2004-2005)
Change detection (firtst image) showed many changes in the river system during the 2004-2005 event. In terms of lowering or rising of the bed surface, both the events were prominient. Around 5700 m3 of the surface lowering occured and 4800 m3 of the surface raising took place with 29% error in both the cases. It can fairly assumed that the river reach was in equilibrium if we compare the two events.
1) Second Epoch (2005-2006)
Change detection (second image) showed few changes in the river system during the 2005-2006 event compared to the 2004-2005 event. . Around 1400 m3 of the surface lowering occured and 1200 m3 of the surface raising took place with 40% error in both the cases. It can fairly assumed that the river reach was in equilibrium if we compare the two events.
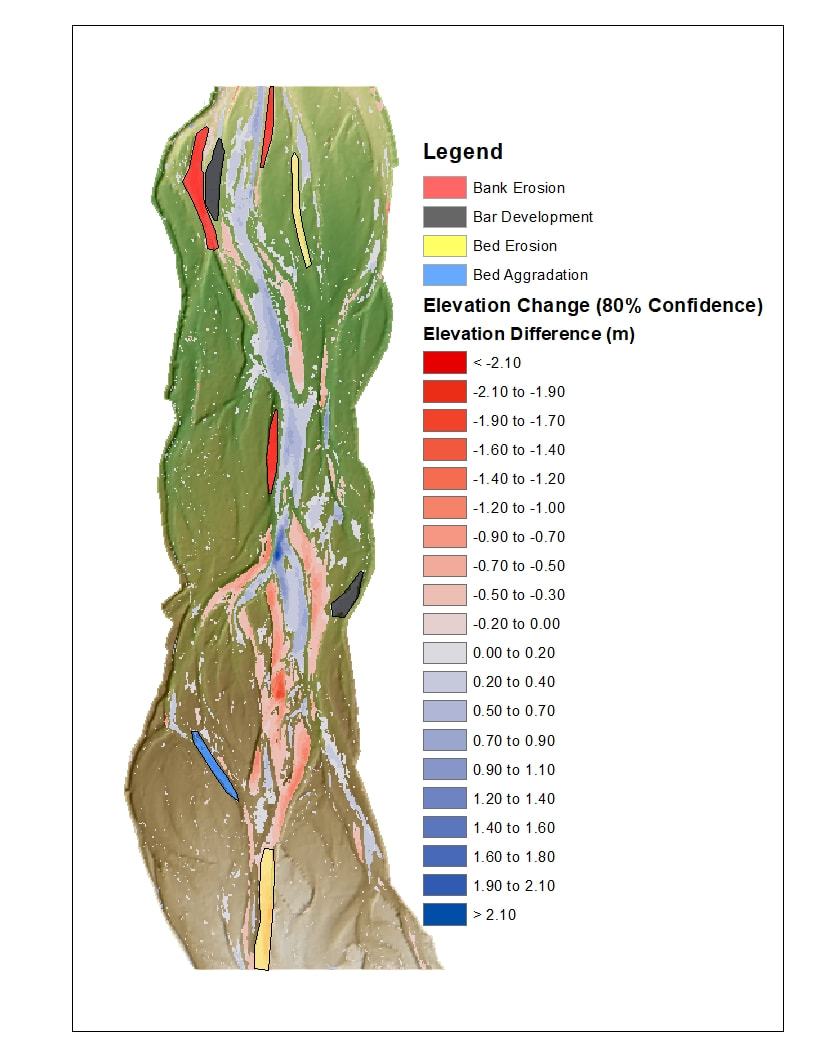
Budget Segragation Analysis
A budget segregation analysis was done for the 2004-2005 event to quantify the effect of each individual event such as bed erosion, bank erosion, bar development etc.
A budget segregation analysis was done for the 2004-2005 event to quantify the effect of each individual event such as bed erosion, bank erosion, bar development etc.