A longitudinal profile of the Logan River from Franklin basin (Latitude 42.0353 degrees and Longitude -111.599127 degrees) to the mouth (Latitude 41.741216 degrees and Longitude -111.938460 degrees) has been plotted as shown in Figure 1. The longitudinal profile was plotted by cutting the DEM of the catchment by the shape file of the Logan River using GIS tool.
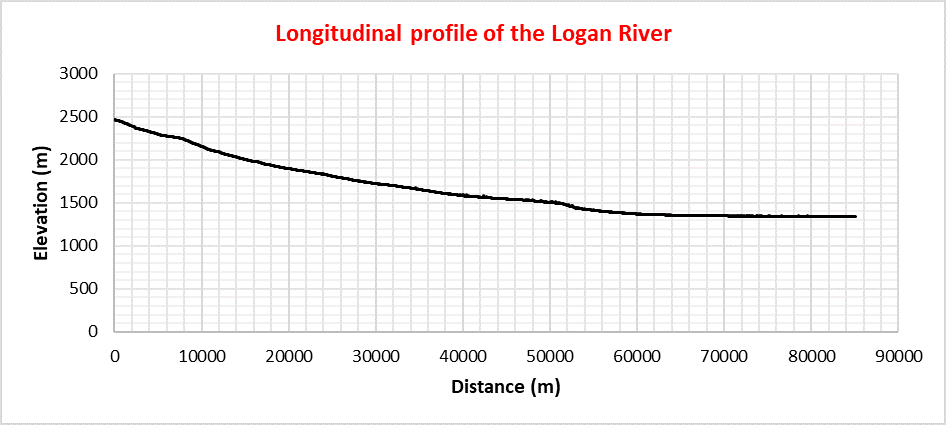
Figure 1: Longitudinal profile of the Logan River
Base Level Control - Present Day
A base level is the lowest level to which the river water can flow. In the absence of any human interventions such as dam, usually the ocean or a large water body such as lakes control the base level in the larger temporal context. In case of the Logan River, the Great Salt Lake is the base level control which is at an elevation of 1282 amsl (Google Earth Reference). However, if we consider the reach under investigation, we can observe that there is a dam (Cutler Reservoir) just downstream the confluence of Bear River and Logan River. Water level in the Logan River cannot fall below the reservoir level. So, currently when the dam is still there and water levels in the reservoir remaining almost constant, it can be said that the Cutler Reservoir is the base level control of the Logan River at present day. The water surface of cutler reservoir is at an elevation of 1343.86 m from the sea level.
Base Level Control - 18000 Years Ago
Lake Boneville that existed nearly 18000 years ago controlled the base level of the Logan River during that time. The bathtub rings visible along the faces of mountains surrounding the cache valley are indicative of the existence of such lake in the past. The highest level of the lake is estimated to be around 1554.5 amsl. Which means, that particular water level in the lake would control the base level of the Logan River during those times.
Lake Boneville that existed nearly 18000 years ago controlled the base level of the Logan River during that time. The bathtub rings visible along the faces of mountains surrounding the cache valley are indicative of the existence of such lake in the past. The highest level of the lake is estimated to be around 1554.5 amsl. Which means, that particular water level in the lake would control the base level of the Logan River during those times.
Mainstream Length
The mainstream length of the Logan River is 86.3639 Km (86363.9 m). However the longitudinal profile has been drawn from a little upstream and considering that point, the mainstream length is 85.105 Km (85105 m).
The mainstream length of the Logan River is 86.3639 Km (86363.9 m). However the longitudinal profile has been drawn from a little upstream and considering that point, the mainstream length is 85.105 Km (85105 m).
|
Concavity
Concavity of a river profile is a unitless quantity given by; Concavity = 2A/H Where, A is the elevation difference between the profile at mid-distance and a straight line joining the ends of the profile. H is the total fall of the longitudinal profile. |
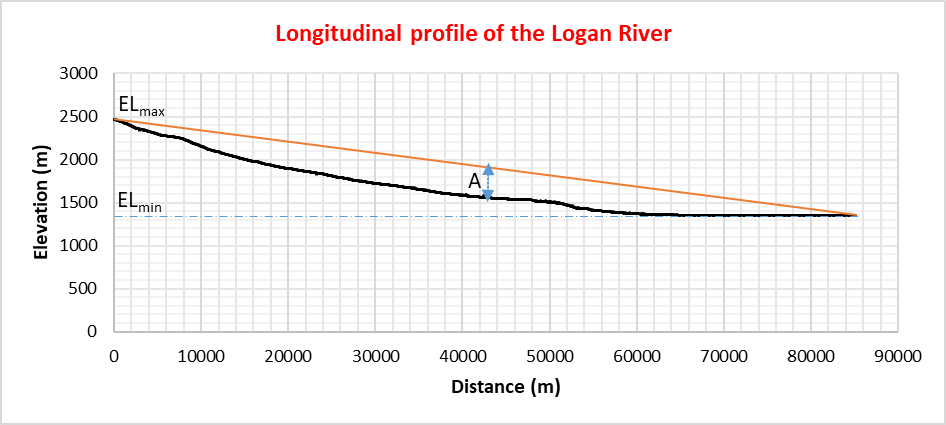
Figure 2: Logan River longitudinal profile showing concavity parameters
|
For the Logan River profile,
Maximum elevation of the profile (ELmax) = 2466.115 amsl
Minimum elevation of the profile (ELmin) = 1344.247 amsl
Difference in elevation (H) = ELmax-ELmin = 1121.869 m
Elevation at mid-distance of river profile = 1560.996 amsl (From the profile data)
Elevation at the mid point of the slope line = 2121.93 amsl
Mid point height difference between lines = 2121.93-1560.996 = 344.184 m
Hence,
Concavity of the Logan River = 2A/H = 2*344.184/1121.869 = 0.613
Usually, rivers have a concave up profile and the Logan River has the same.
|
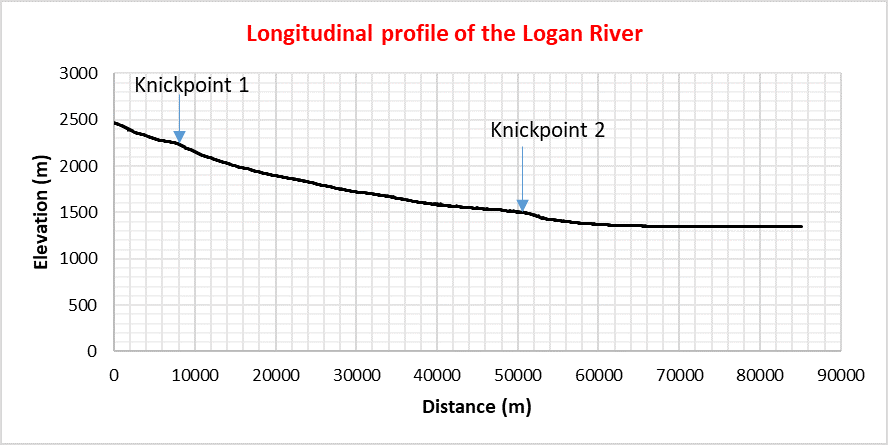
Knickpoints
A knickpoint is a part of the river channel that shows a distinct change in its bed slope. There are two major knickpoints observed along the Logan River profile. Knickpoint 1 Knickpoint 1 lies in the upstream part of the channel at a distance of around (8-9) km from the upstream end. If we refer to the google earth images, there is a wide valley just upstream of the knickpoint 1 and gets narrower at the region of knickpoint. It can be hypothesized that the water speeds up at the narrow part and if it has an erodible bed formation, the river bed is lowered locally at such regions resulting in a sharp change in the bed slope. It is interesting to see that after the region of knickpoint 1 the valley gets wider and the slope again gets milder. |
|
Knickpoint 2
Knickpoint 2 lies at a distance of about (50-51) km from the upstream of the Logan River Channel. The lithological formation, topography might have led to the formation of such knickpoint. It can also be hypothesized that when the Boneville lake dried up, Logan River started adjusting to the new levels (mostly on the downstream part which would have been submerged by the lake). A rapid erosion leading to the exposure of stable local bed at that stretch might have caused the steep slope in that portion and the erosion did not propagate further upstream. Such, process might also have caused the 2nd nickpoint.
If we have a closer look, there is a third knickpoint also. This lies exactly at the point where 1st dam is located. The dam has caused a local mild slope after which a steeper slope follows.
