1. North Fork Asotin Creek - A Brief Overview
North Fork Asotin Creek is a perinneal stream which lies in Washington, United States. It is one of the tributaries to Asotin Creek. Three major creeks viz. Charley Creek, North Fork Asotin Creek and South Fork Asotin Creek drains to the Asotin Creek. The North Fork Asotin Creek has a basin area of 165 km2 with average annual discharge of 60 cfs, average gradient of 1.7 and average bank-full width of 9m (Wheaton et al., 2015).
Asotin Creek is one of the intensively monitored watersheds with restoration efforts to increase the fish population in the river. However, the North Fork Asotin Creek which lies in the upper part of the catchment has not been subjected to restoration efforts. It is a naturally controlled stream with lots of vegetation around it’s periphery. The upper part of the catchment is densely vegetated (closed tree canopy). Towards the downstream end, it is less vegetated and covered mostly by harbaceous grassland as shown in Figure 1. The upper part of the catchment has dendritic type of perinneal drainage network which is absent in the downstream reaches.
For the purpose of this assignment two different sites on the North Fork Asotin Creek have been considered for study.
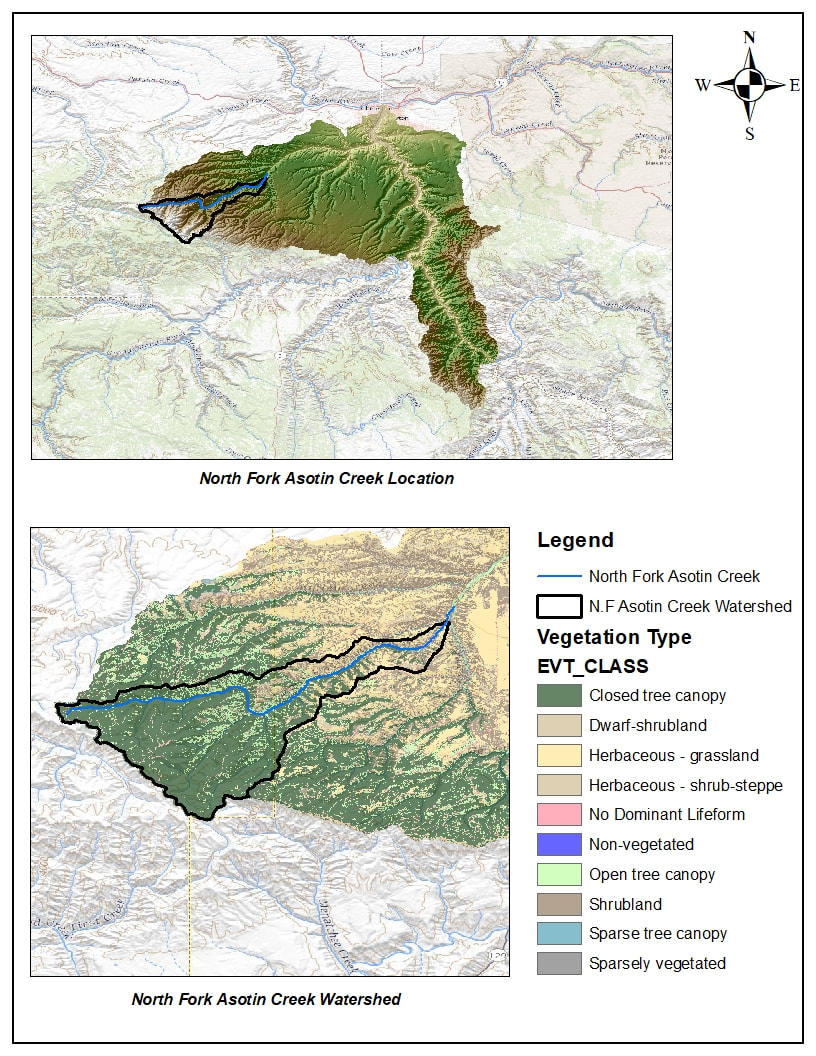
Figure 1: Location of the North Fork Asotin Creek
2. North Fork Asotin F4
2.1 Qualitative description of river reach (F4) morphology
This is a more confined reach with almost constant width of the stream and the flow is basically confined within a single channel. The thalweg passes mostly along the centerline of the planform of the stream apart from a few areas where it is nearer towards the outer bend. Most of the reach exhibits a planar form. Although the portion of the thalweg is mostly concave, some convexities can be observed near the bank mostly dominated by the right bank. The reach mostly has a planar bed form and flows repeatedly in the form of glide-run. Pools can be observed along the stream at different locations. Bars are mostly attached to the sides of the river which is obvious due to the mostly straight and narrow river width. Mid channel bars have no place in this reach.
2.2 Selection of two survey years for studying temporal variability
Survey year 2012 and 2017 have been selected for the purpose of studying temporal variability of morphology of the reach. It is because, 2017 is the latest survey and 2012 is the oldest with similar extent of survey which is comparable. 2011 doesn’t have a similar survey pattern. Although it is the oldest.
Survey year 2012 and 2017 have been selected for the purpose of studying temporal variability of morphology of the reach. It is because, 2017 is the latest survey and 2012 is the oldest with similar extent of survey which is comparable. 2011 doesn’t have a similar survey pattern. Although it is the oldest.
|
2.3 What Tier 2 forms are present in each year? Do they differ?
Following Tier 2 forms are present. Tier 2 Forms Year-2012 Year-2017 Wall Wall Mound Mound Trough Trough Plane Plane Bowl Bowl Saddle Based on the outputs of GUT, Tier 2 forms present each year during 2012 and 2017 are mostly the same. However, during 2017 a new saddle form appears in the reach. Figure 2 and Figure 3 on the right shows the distribution of different tier 2 forms in the F4 reach during the years 2012 and 2017 respectively. |
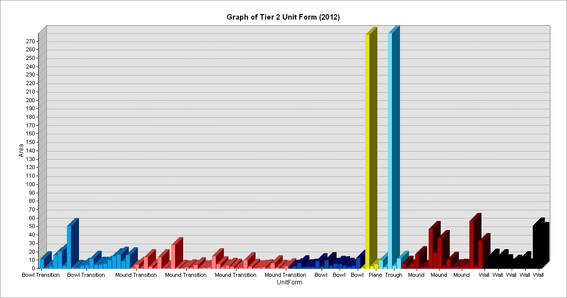
Figure 2: Tier 2 forms present in the survey year 2012
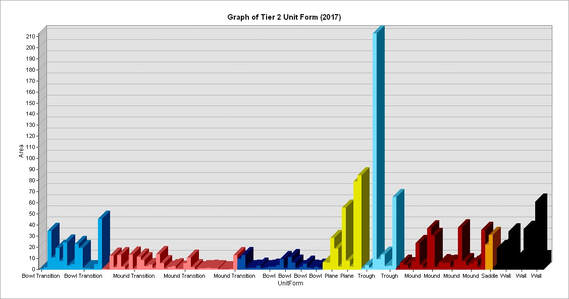
Figure 3: Tier 2 forms present in the survey year 2017
|
2.4 Do any of the Tier 2 forms dominate the assemblage or is it fairly mixed? Is this true through time?
There is not a distinct dominance of a particular form over the others. However some planar shaped forms such as plane and trough as well as convex shaped form such as mound have dominant appearance in both the instances (years). Saddle appears the least followed by the bowl.
This dominance is fairly true over time. However, a saddle form which is not present in 2012 appears in 2017. The occurance of different Tier 2 forms and their distribution can also be realised from Figure 2 and Figure 3.
|
2.5 What Tier 3 Geomorphic Units are present in each year?
Following Tier 3 Geomorphic Units are present. Tier 3 Forms Year-2012 Year-2017 Cascade Cascade Glide-Run Glide-Run Margin Attached Bar Margin Attached Bar Pocket Pool Pocket Pool Pool Pool Rapid Riffle |
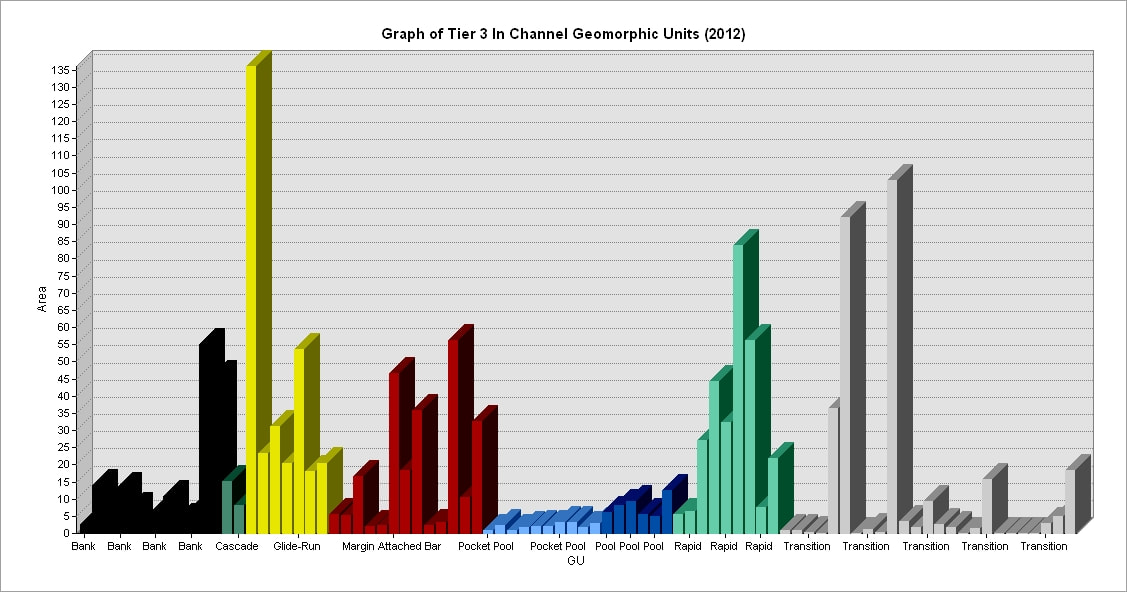
Figure 4: Tier 3 forms in the reach (2012)
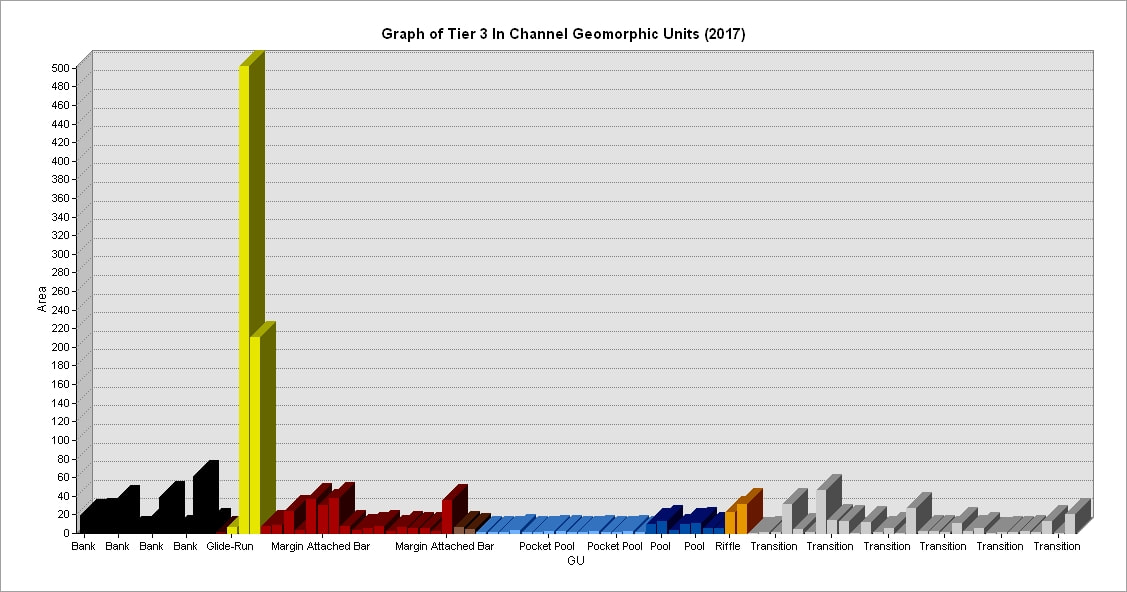
Figure 5: Tier 3 forms in the reach (2017)
|
2.6 Zoom in to 2 to 5 x bankfull width portion of the reach and look at the arrangement of geomorphic units. Is it coherent? Does it make sense based on what you have learned so far?
At the end of the reach in 2012, there is a pool after a cascade which is quite expected. Similarly, a bar on the inner part of the bend is an anticipated output.
Although most part of the arrangement makes sense. There are some instances when the results might not be representative. There are minimum transitions between the geomorphic units along the flow directions. A sudden appearance of a pool in a continuous glide-run is usually not expected unless there is some forcing that induces it. However, woody debris in the middle of a run might locally elevate the water level and a pool like unit can be formed.
2.7 How well does GUT appear to be doing in each year at discriminating the in channel geomorphic units? Point out any weaknesses or concerns you might have.
Although there can be various governing factors such as the error in survey data aquisition, various tolerences used by the GUT in delineating GU’s and the theories it dwells on; it gives a fair understanding and representation of the in channel geomorphic units in the reach studied here. The qualitative information from the GUT can be more reliable than its quantitative intrepretation and qualitatively the GUT performed pretty good. In both the surveys (2012 & 2017), the pools were effectively mapped. The lateral bars on the sides of the river were amply delineated. The planar forms which are representative of this reach were fairly seen in both the surveys (2012 & 2017).
However, transition zones are not quite well represented along the river profile. While shifting from one form to another form, usually there is some grey transition area which is usually undefined. This is not seen in the GUT outputs. The features are just separated by a single line. But still, GUT fairly serves its purpose.
2.8 Identify in one of your surveys for this reach a distinctive pool, bar and planar feature. For all three identify all five attributes from the fluvial taxonomy (i.e., Table 6), then use those to identify the Tier 3 name from Table 7 or 8 (this may differ than what GUT output is because it is not as resolved) and explain which attribute(s) were key for discriminating that unit from other units.
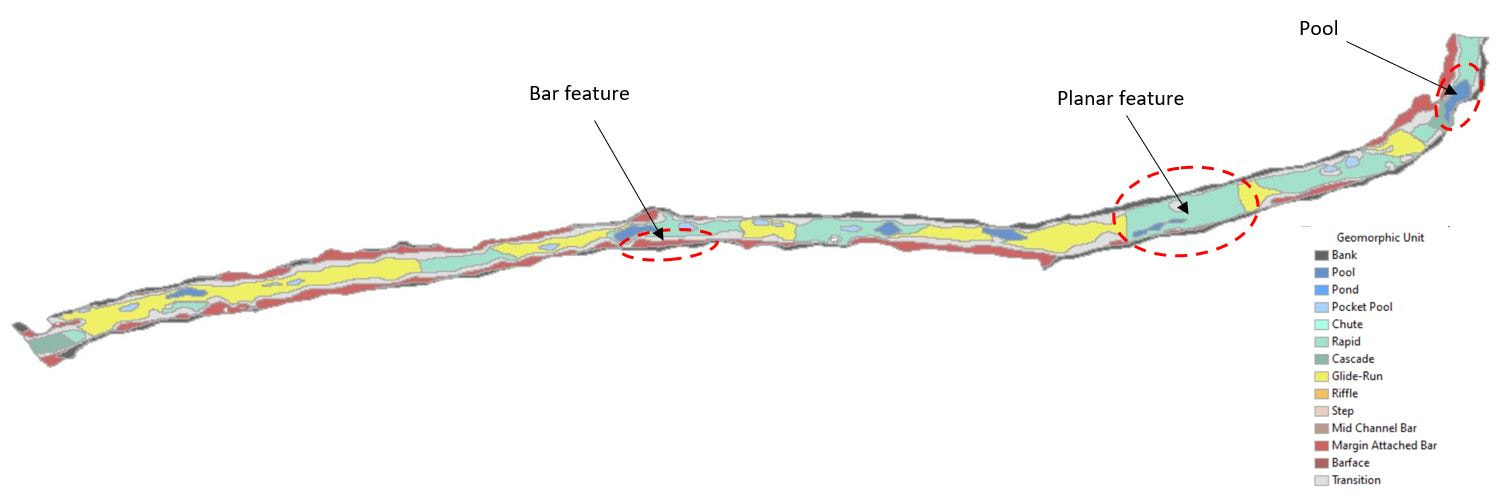
Figure 6: In Channel Geomorphic Units at F4 (2012)
|
2.8A : Pool
GU Forcing: By Geomorphic Unit (Cascade drop + Bar on the left bank) GU Orientation: Streamwise GU Position: Bank attached Low Flow WS Slope: Moderate Low flow Relative Roughness: Low (<0.5) Tier 3 Name: Structurally forced pool Key Attributes for Discriminating: The observation of the contour lines and the water depth data clearly indicated that it has a concave shape and among the concave shaped units, it exhibits specific morphology similar to a pool. The pool occurs in a narrow section (flow width constriction) leading to erosion and forming the pool. Hence, caterogized as a structurally forced pool. Differences with GUT: In terms of mapping the feature as a pool, there is no difference with GUT. Still there are some categorical discrepancies. The GUT identified the position and orientation as margin attached and longitudinal respectively. Similarly, the Tier 3 name is also different from GUT (Pool). The GUT doesn't explicitly mention the GU forcing, low flow water surface slope and low flow relative roughness. |
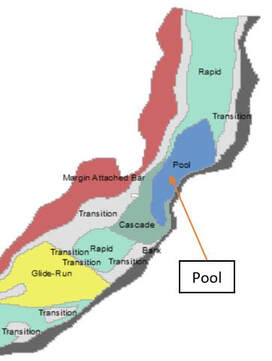
Figure 6: Identified Pool (2012 Survey)
|
|
2.8B : Bar
GU Forcing: Flow Width GU Orientation: Streamwise GU Position: Bank Attached Low Flow WS Slope: Moderate Low flow Relative Roughness: Very high (>>1) Tier 3 Name: Lateral Bar Key Attributes for Discriminating: The streamwise, bank attached position along with the fact that it is occurring on an almost straight section of the stream reach. Differences with GUT: In terms of mapping the feature as a bar, there is no difference with GUT. Still there are some categorical discrepancies. The GUT identified the position and orientation as margin attached and longitudinal respectively. Similarly, the Tier 3 name is also different from GUT (Margin attached bar). The GUT doesn't explicitly mention the GU forcing, low flow water surface slope and low flow relative roughness. |
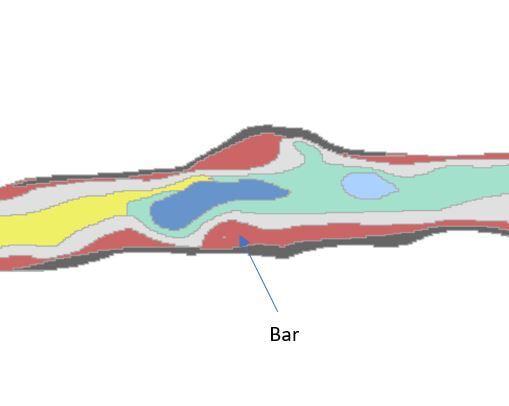
Figure 7: Identified bar feature (2012 Survey)
|
|
2.8C : Planar
GU Forcing: Not Forced GU Orientation: Streamwise GU Position: Channel Spanning Low Flow WS Slope: Moderate (Approximately 0.025) Low flow Relative Roughness: Moderate-High (Around 0.8 to 1) Tier 3 Name: Rapid Key Attributes for Discriminating: The feature is a planar feature with a relatively high low flow relative roughness (0.8-1). Additionally, it has a moderate low flow water surface slope. Hence it is categorized as a rapid. Differences with GUT: In terms of mapping the feature as a planar feature, there is no difference with GUT. Still there are some categorical discrepancies. The GUT identified the position and orientation as mid channel (instead of channel spanning) and longitudinal (streamwise) respectively. The GUT doesn't explicitly mention the GU forcing, low flow water surface slope and low flow relative roughness. |
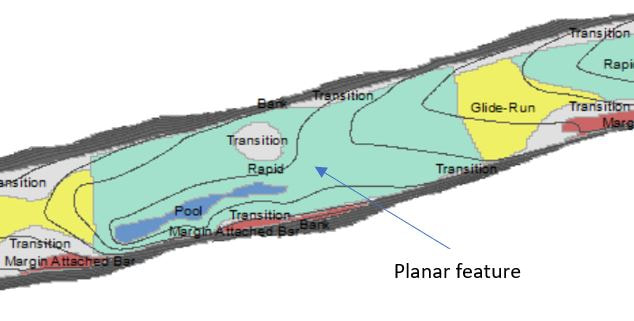
Figure 8: Identified planar feature (2012 Survey)
|
2.9 Turn off GUT and look just at the Topo DEM (e.g Detrended DEM and Contours) for one of the surveys. Manually map one geomorphic unit you think you can read in the topography.
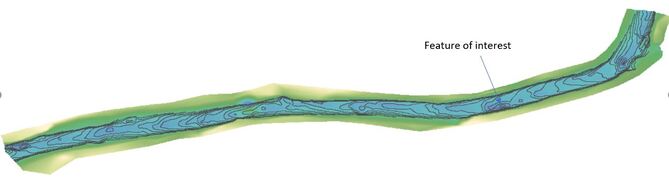
Figure 9: Detrended DEM and contour lines (2017 Survey, Site F4)
|
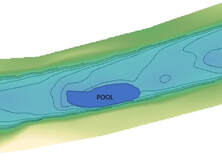
Figure 9-a: Manual mapping of a pool (Site F4, 2017 Survey)
|
2.9A - What is the tier 2 Form and the tier 3 shape of the unit you manually identified?
It has a concave shaped unit with its tier 2 form identified as a bowl. In tier 3 it can be categorized as a bank attached pool.
2.9B - How do the boundaries of the unit you mapped compare with what GUT derived?
The boundary of the manually mapped unit varies slightly with the boundary derived from the GUT. The manually mapped boundary is slightly bigger than the GUT output.
2.9C - How does the type you identified compare with what GUT identified? Explain the discrepancies if they exist.
Both identified feature as a pool. However, the GUT categorized the position as mid channel and orientation as longitudinal. It seems GUT uses the term longitudinal for streamwise.
The discrepency in naming the position is solely due to manual mapping instinct and limited resolution of contour data. The contours on the right of the pool (near to the bank) are very densly packed. Hence, bank attached term was used as the position of the pool.
3. North Fork Asotin F6
3.1 Qualitative description of river reach morphology
Unlike the F4 reach, this reach (F6) is a less confined reach with varying width of the stream. The reach has similar vegetation on the sides as that of F4. Planar forms are mostly observed in this reach too. This reach also has a couple of bends. Apart from some bank attached bars, mid channel bars are also present. Consequently, more than one flow channel are also present at some sections.
3.2 Selection of two survey years for studying temporal variability
Survey year 2012 and 2017 have been selected for the purpose of studying the temporal variability of the morphology of the reach. It is because, 2017 is the latest survey and 2012 is the oldest with similar extent of survey which is comparable. 2011 doesn’t have a similar survey pattern. Although it is the oldest.
Additionally, using the same years for both the reaches (because 2012 and 2017 were used for site F4) makes the comparison more relatable as they have gone through similar hydrological events.
|
3.3 What Tier 2 forms are present in each year? Do they differ?
Following Tier 2 forms are present. Tier 2 Forms Year-2012 Year-2017 Wall Wall Mound Mound Trough Trough Plane Plane Bowl Bowl Saddle Saddle Based on the outputs of GUT, Tier 2 forms present each year during 2012 and 2017 are mostly the same. Figure 10 and Figure 11 on the right shows the distribution of different tier 2 forms in the F6 reach during the years 2012 and 2017 respectively. |
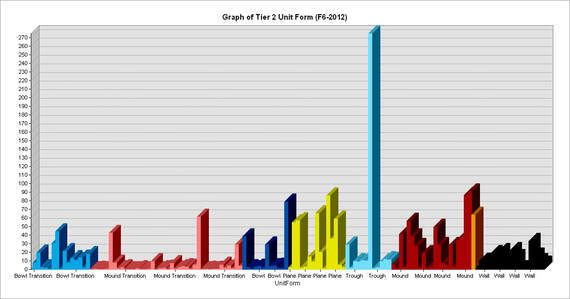
Figure 10: Tier 2 forms present in survey year 2012 (F6)
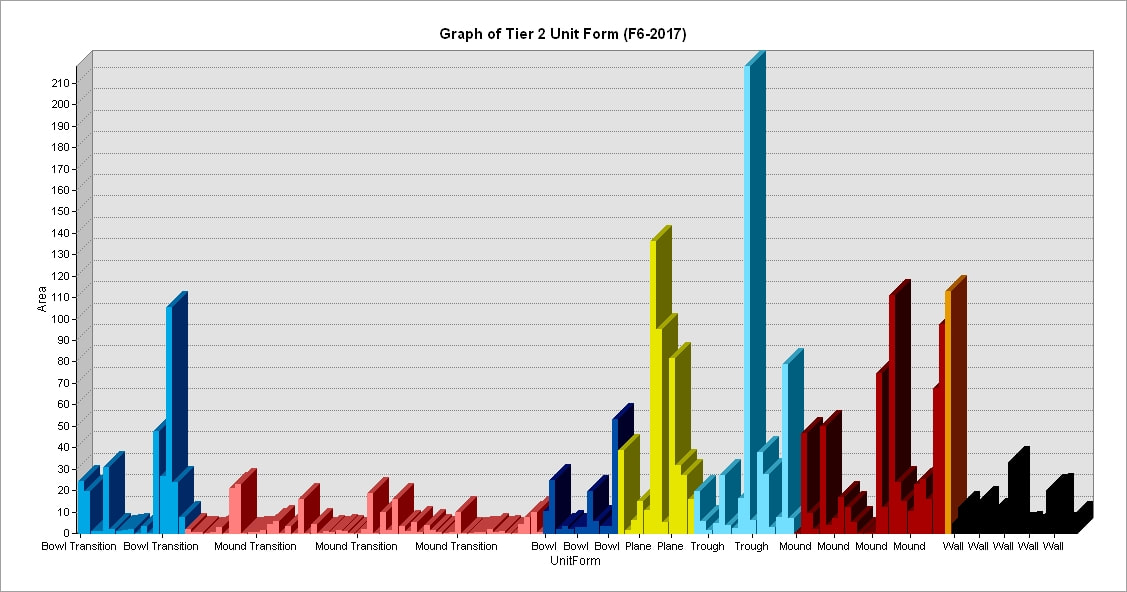
Figure 11: Tier 2 forms present in survey year 2017 (F6)
|
3.4 Do any of the Tier 2 forms dominate the assemblage or is it fairly mixed? Is this true through time?
There is not a distinct dominance of a particular form over the others. However some planar shaped forms such as plane and trough as well as convex shaped form mound have dominant appearance in both the instances (years). Saddle appears the least followed by the bowl. This proportional distribution is fairly true over time. Although the forms remain the same, their quantitative distribution varies. Some features gain and some loose their coverage. Distinctively, in 2017, a saddle appears around mid way of the reach replacing a glide-run. Similarly, pools become less elongated in 2017.
There is not a distinct dominance of a particular form over the others. However some planar shaped forms such as plane and trough as well as convex shaped form mound have dominant appearance in both the instances (years). Saddle appears the least followed by the bowl. This proportional distribution is fairly true over time. Although the forms remain the same, their quantitative distribution varies. Some features gain and some loose their coverage. Distinctively, in 2017, a saddle appears around mid way of the reach replacing a glide-run. Similarly, pools become less elongated in 2017.
|
3.5 What Tier 3 Geomorphic Units are present in each year?
Following Tier 3 Geomorphic Units are present. Tier 3 Forms Year-2012 Year-2017 Cascade Cascade Glide-Run Glide-Run Margin Attached Bar Margin Attached Bar Mid Channel Bar Mid Channel Bar Pocket Pool Pocket Pool Pool Pool Rapid Rapid Riffle Riffle Barface Barface Figure 12 and Figure 13 on the right shows the distribution of different tier 2 forms in the F6 reach during the years 2012 and 2017 respectively. |
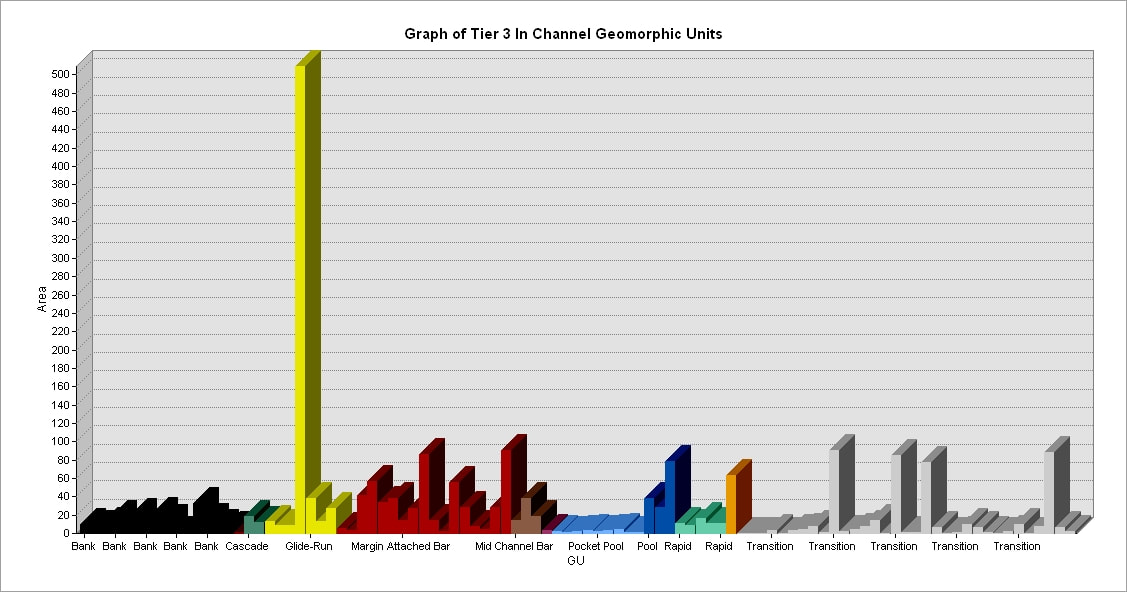
Figure 12: Tier 3 forms present in survey year 2012 (F6)
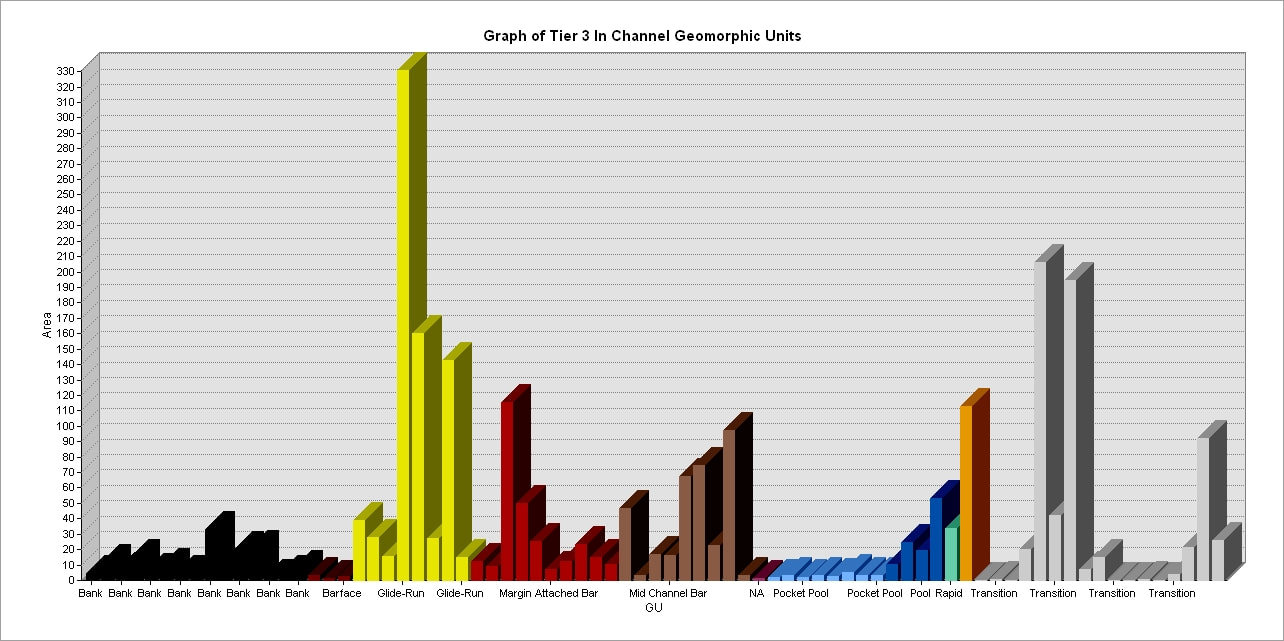
Figure 13: Tier 3 forms present in survey year 2017 (F6)
|
3.6 Zoom in to 2 to 5 x bankfull width portion of the reach and look at the arrangement of geomorphic units. Is it coherent? Does it make sense based on what you have learned so far?
Most of the arrangement of geomorphic units appears to be logical with some exceptions. There are some bar forced pool towards the end of the reach (2012 survey). In both survey years we can observe bars at the inner parts of the bend. Similarly, in 2017 survey, a riffle appears at a bend towards middle of the reach upstream of which there is a pool. These are some logical outputs.
Contrarily, there are some questionable outputs also. In both the surveys (mostly in 2017), bars present near the banks which are mostly bank attached have been categorized as mid channel bars. Similarly there are transition zones in the middle of a bar (mostly seen in 2017 survey).
3.7 How well does GUT appear to be doing in each year at discriminating the in channel geomorphic units? Point out any weaknesses or concerns you might have.
In this site also the GUT doesn't perform that bad at discriminating the GU. Most of the units are identified as expected. It seems like it is overestimating the mid channel bars in both 2012 and 2017 surveys. Similarly, there are no clear transition zones along the river profile. A discrete single line should not be delineating two different features.
In this site also the GUT doesn't perform that bad at discriminating the GU. Most of the units are identified as expected. It seems like it is overestimating the mid channel bars in both 2012 and 2017 surveys. Similarly, there are no clear transition zones along the river profile. A discrete single line should not be delineating two different features.
3.8 Identify in one of your surveys for this reach a distinctive pool, bar and planar feature. For all three identify all five attributes from the fluvial taxonomy (i.e. Table 6), then use those to identify the tier 3 name from Table 7 or 8 (this may differ than what GUT output is because it is not as resolved) and explain which attribute(s) were key for discriminating that unit from other units.
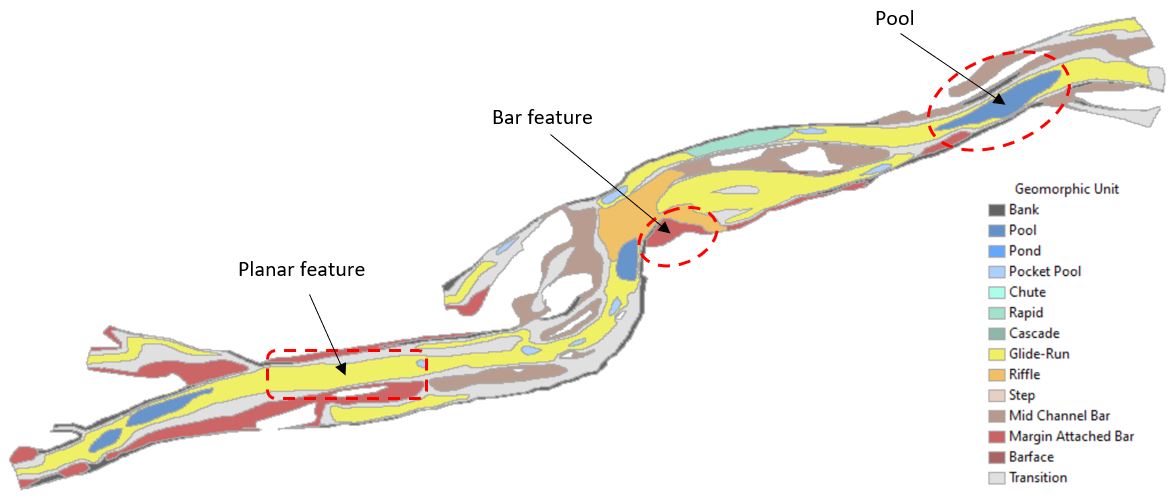
Figure 14: In Channel Geomorphic Units at F6 (2017)
|
3.8A : Pool
GU Forcing: Flow Width GU Orientation: Streamwise GU Position: Mid Channel Low Flow WS Slope: Shallow (<0.005) Low flow Relative Roughness: Low (<0.5) Tier 3 Name: Structurally forced pool Key Attributes for Discriminating: The pool occurs in a narrow section leading to erosion and forming the pool. Hence, caterogized as a structurally forced pool. Its not completely attached to the banks. So its position is mid channel. Differences with GUT: GUT classifies it as just a pool and not according to the Table 8 nomenclature (structurally forced pool). The GUT identified the position and orientation as margin detached and longitudinal respectively. Similarly, the Tier 3 name is also different from GUT (Pool). The GUT doesn't explicitly mention the GU forcing, low flow water surface slope and low flow relative roughness. |
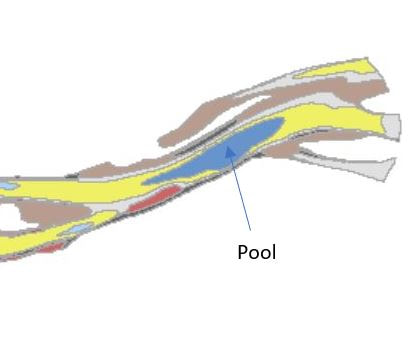
Figure 15: Identified pool feature F6 (2017)
|
|
3.8B : Bar
GU Forcing: Planform forced GU Orientation: Streamwise GU Position: Bank attached Low Flow WS Slope: Moderate Low flow Relative Roughness: Moderate Tier 3 Name: Point Bar Key Attributes for Discriminating: It is bank attached located on the inside of the bend. It is forced by the planform. Hence categorized as a point bar. Differences with GUT: The GUT identifies it as a margin attached bar. As per GUT, orientation is diagonal and position is margin attached. |
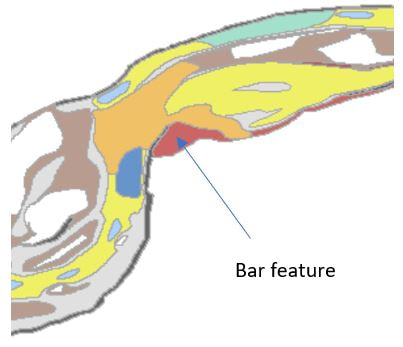
Figure 16: Identified bar feature F6 (2017)
|
|
3.8C : Planar
GU Forcing: Not forced GU Orientation: Streamwise GU Position: Mid channel Low Flow WS Slope: Shallow Low flow Relative Roughness: Low Tier 3 Name: Glide Key Attributes for Discriminating: The shallow water surface slope and the low relative roughness were key attributes in discriminating it as a glide. Differences with GUT: The GUT identifies it as a glide-run with a channel spanning position and diagonal orientation. This is very different from the identified results. |
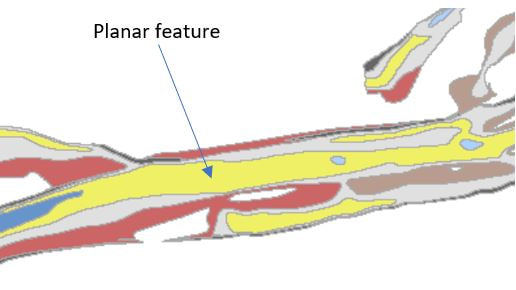
Figure 17: Identified planar feature F6 (2017)
|
3.9 Turn off GUT and look just at the Topo DEM (e.g Detrended DEM and Contours) for one of the surveys. Manually map one geomorphic unit you think you can read in the topography.
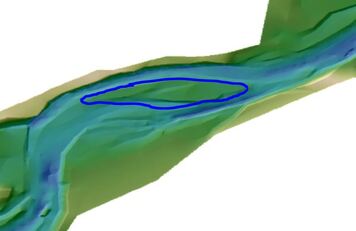
Figure 18: Manually mapped GU, F6 (2017 data)
3.9A - What is the tier 2 Form and the tier 3 shape of the unit you manually identified?
It has a convex shaped unit with its tier 2 form identified as a mound. In tier 3 it can be categorized as a bar.
3.9B - How do the boundaries of the unit you mapped compare with what GUT derived?
The boundary of the manually mapped unit matches very well with what GUT derived.
3.9B - How does the type you identified compare with what GUT identified? Explain the discrepancies if they exist.
Both identified the feature as a bar. However, the tier 3 name (mid channel bar) given by the GUT output is not in the categories from table 8. Similarly, uses the term longitudinal for streamwise.
4. Differences between F4 and F6
4.1 What are the primary differences from exploring GUT between these two sites that you noticed between the in channel geomorphic units of these two sites?
The two sites under consideration are quite different reaches of the same stream (North Fork Asotin Creek). One of the major differences between the two sites is the heteroginity in the spatial distribution of the geomorphic units. In site F4 the bars are mostly attached to the banks and do not protrude much into the flow channel. However, site F6 is more wide and the existence of bars is totally different than F4. Rather than being concentrated only near the bank, bars are also seen towards the centreline. Mid-channel bars are prominent in site F6. Another distinct observation is that the repetition of the geomorphic units across a cross-section is more in F6 than F4. The temporal distribution of geomorphic units is more uniform in F4 than F6, meaning F6 shows reworking with time.
The two sites under consideration are quite different reaches of the same stream (North Fork Asotin Creek). One of the major differences between the two sites is the heteroginity in the spatial distribution of the geomorphic units. In site F4 the bars are mostly attached to the banks and do not protrude much into the flow channel. However, site F6 is more wide and the existence of bars is totally different than F4. Rather than being concentrated only near the bank, bars are also seen towards the centreline. Mid-channel bars are prominent in site F6. Another distinct observation is that the repetition of the geomorphic units across a cross-section is more in F6 than F4. The temporal distribution of geomorphic units is more uniform in F4 than F6, meaning F6 shows reworking with time.
4.2 What inferences can you make about geomorphic processes and behavior when contrasting GUT outputs between these two sites?
A channel with larger bankful width is more variable than the one with a smaller bankful width. Presence of bends also keep the morphology changing with time. Similarly, the outputs of the GUT is skewed if there is a heterogenous distribution of the geomorphic units, which was evidently seen in site F6.
A channel with larger bankful width is more variable than the one with a smaller bankful width. Presence of bends also keep the morphology changing with time. Similarly, the outputs of the GUT is skewed if there is a heterogenous distribution of the geomorphic units, which was evidently seen in site F6.
4.3 If you only had one GUT output from each of these two sites (i.e. one snap shot) how representative would be your inferences about geomorphic processes? If you did not have the luxury of six or seven surveys, but just one, would your conclusions above be different?
The output of GUT in terms of the distribution of the geomorphic units in a certain each is independent of the number of surveys. A particular output is based only on a single survey. However, taking a number of surveys enables to study the reach during those instances and a number of GUT outputs will only help to study the trend of changes.
The output of GUT in terms of the distribution of the geomorphic units in a certain each is independent of the number of surveys. A particular output is based only on a single survey. However, taking a number of surveys enables to study the reach during those instances and a number of GUT outputs will only help to study the trend of changes.
5. Synthesis
5.1 How are the Tier 2 Forms from GUT different than what we discussed in field?
They are basically similar. However the GUT gives also the outputs of transitions such as mould transition and bowl transition.
They are basically similar. However the GUT gives also the outputs of transitions such as mould transition and bowl transition.
5.2 How are the Tier 3 GUs GUT exports different than the ones we discussed? Why do you think GUT does not output the same things?
The difference is basically due to the theory behind the working of the GUT and various tolerances used to differentiate one unit from the other.
The difference is basically due to the theory behind the working of the GUT and various tolerances used to differentiate one unit from the other.
5.3 How would you apply Tier 4? Do you have enough information here to do that?
In Tier 4 we basically subject the GU to its texture (surface roughness) in terms of grain size or vegetation. When we have those data we can apply it to get the Tier 4 classification. In the current study we have roughness height and the vegetation cover for the area which can be applied to get the Tier 4 category.
In Tier 4 we basically subject the GU to its texture (surface roughness) in terms of grain size or vegetation. When we have those data we can apply it to get the Tier 4 classification. In the current study we have roughness height and the vegetation cover for the area which can be applied to get the Tier 4 category.
5.4 Does exploring these GUT outputs give you more or less confidence in applying the fluvial taxonomy through manual mapping-off of topography versus identification in the field?
Although the GUT is not exactly representative of the field, it appears to be a very useful tool for fluvial taxonomy and projects a lot of information about the in channel morphological units. Manual mapping can be erronous in terms of size of a GU as well as in distinguishing between similar types of forms. Its difficult to map GU manually from topography and hence might not be well compareble with the GUT outputs in a number of cases. However, field identification allows us to gather the most information and identify many features.
Although the GUT is not exactly representative of the field, it appears to be a very useful tool for fluvial taxonomy and projects a lot of information about the in channel morphological units. Manual mapping can be erronous in terms of size of a GU as well as in distinguishing between similar types of forms. Its difficult to map GU manually from topography and hence might not be well compareble with the GUT outputs in a number of cases. However, field identification allows us to gather the most information and identify many features.
